Featured

My First Blog Post

We cannot seek achievement for ourselves and forget about progress and prosperity for our community…Our ambitions must be broad enough to include the aspirations and needs of others, for their sakes and for our own.

— Cesar Chavez.

This is the first post on my new blog. I’m just getting this new blog going, so stay tuned for more. Subscribe to get notified when I post new updates via Twitter: https://twitter.com/SSachiye

Featured

Introducing Myself

Welcome! I hope you enjoy my blog and the future posts to come. I wanted my first post to set the tone and give new readers context, more information about me, and reasons for why you should read my blog. Below are some questions and answers to get to know me better and to understand what I will be blogging about:

First, what are some personal facts about me?

  • I played golf competitively as a student-athlete at a division I college and won an All American Scholar Award from the National Golf Coaches Association.
  • I worked in Washington, D.C., doing work related to data analytics, at major firms and organizations, including the International Monetary Fund and Fannie Mae.
  • My name Sachiye means “Blessed Happiness” in Japanese.

What are more details on my professional career that could be insightful?

  • One job I would like to share in more detail is working with the Office of Management and Budget.
  • Office of Management and Budget is part of the Executive Office of the President that handles the President’s budget and management policies for all federal agencies. I worked in an office that specifically focused on IT management policies for all 24 federal agencies directed by the federal Chief Information Officer (CIO).
  • My role was a data analyst consultant to help lead the analysis on PortfolioStat, data-driven meetings with agency leadership on information technology spending and the Obama Administration’s efforts to modernize the Federal Government. As a consultant, I helped create a standardized methodology to hold all 24 federal agencies accountable for efficient spending and implementing high priority initiatives of the Administration. I created metrics, I automated reporting, and provided feedback on analysis.
  • This was my first government job. While it was only for 9 months, as a consultant I learned a lot to work for such a client.
  • I learned how to work with budget officials, business executives from different agencies, and how to support an elected official.
  • I also used highly-skilled coding for automation work to ensure the client I was helping could be as efficient as possible for their reporting.
  • I would like to share some of my experiences working for these real clients and tips on how to be effective at your job as a data analyst through this blog and through teaching. I have worked with a variety of different clients to help you become a pro-data analyst expert in your field of interest.

Why am I blogging publicly?

  • I’m blogging publicly to share some of my expertise and commentary to my readers. I’m hoping to foster a love for data analytics and an interest to look at data in strategic and insightful ways.

What topics do I think I’ll write about?

  • I’ll be writing about statistics or studies I see in the news to provide insight into how to interpret analysis and limitations of data. I’m hoping this will provide more strategic thinking to my readers and gather more interest in data analysis.
  • I’ll be sharing fun articles and links on data analysis that gives tips for your career.
  • I’ll be sharing posts about open source technology and their importance. Open source technology, like R (a software I’m teaching), is important to learn as these are free tools at your disposal you can use at any place or time. These are good pragmatic tools to learn. There will be no cost hindrance to use these tools for data analysis work and you should be able to use these tools at any company. (I specifically decided to focus on R for teaching because it has the best visualizations capabilities out of the free open source applications.)

Why do I like data analytics?

  • I am a very analytical person and I like to think strategically about communication. It is also a very transferable skill that can be used in any field or company.

Who would I love to connect with via my blog?

  • Any current or prospective leaner of data analytics or anyone from the public that’s interested in my writing.


‘Ask a Manager’ blog site: Handling workplace questions

Another blog site that can maybe help with your career!

This blog site is called “Ask a Manager” by Alison Green who has been responsible for hiring, firing, promoting, and managing people. Her blog site is used for any uncomfortable or tricky work related questions to common general work questions that people might have anxiety over. It’s not specific to any industry, but might be helpful to read or to ask your own questions if you have any. People have interesting dilemmas she addresses and she gives great advice! https://www.askamanager.org/about

You can see the topics she covers here.

Importance of SQL and RegEx

Both SQL and RegEx, programming languages, are going to be taught in my classes along side R. SQL and RegEx are used across a plethora of data analytics softwares from R and Python open source softwares to proprietary softwares, like SAS, and to business intelligent tools, like Tableau. Learning these universal programming languages can be very helpful.

SQL is a programming language for databases. It pulls data, can restructure data, and can filter data to a particular subset in your analytical software, like R.

RegEx is a programming language for strings (or also known as text fields), which could be complex to edit otherwise without knowing that language, and again, it’s used across many data analytics softwares, like R, where the language can be embedded.

In my training, I teach both SQL and RegEx plus the programming language R in R open source software!

Knowing these languages can make your life easier if having to work on or try different softwares. SQL and RegEx are so universal and helpful. It will really help you in your job pursuing a data analytics career.

Here’s a great SQL cheat sheet if want to start learning and trying yourself!

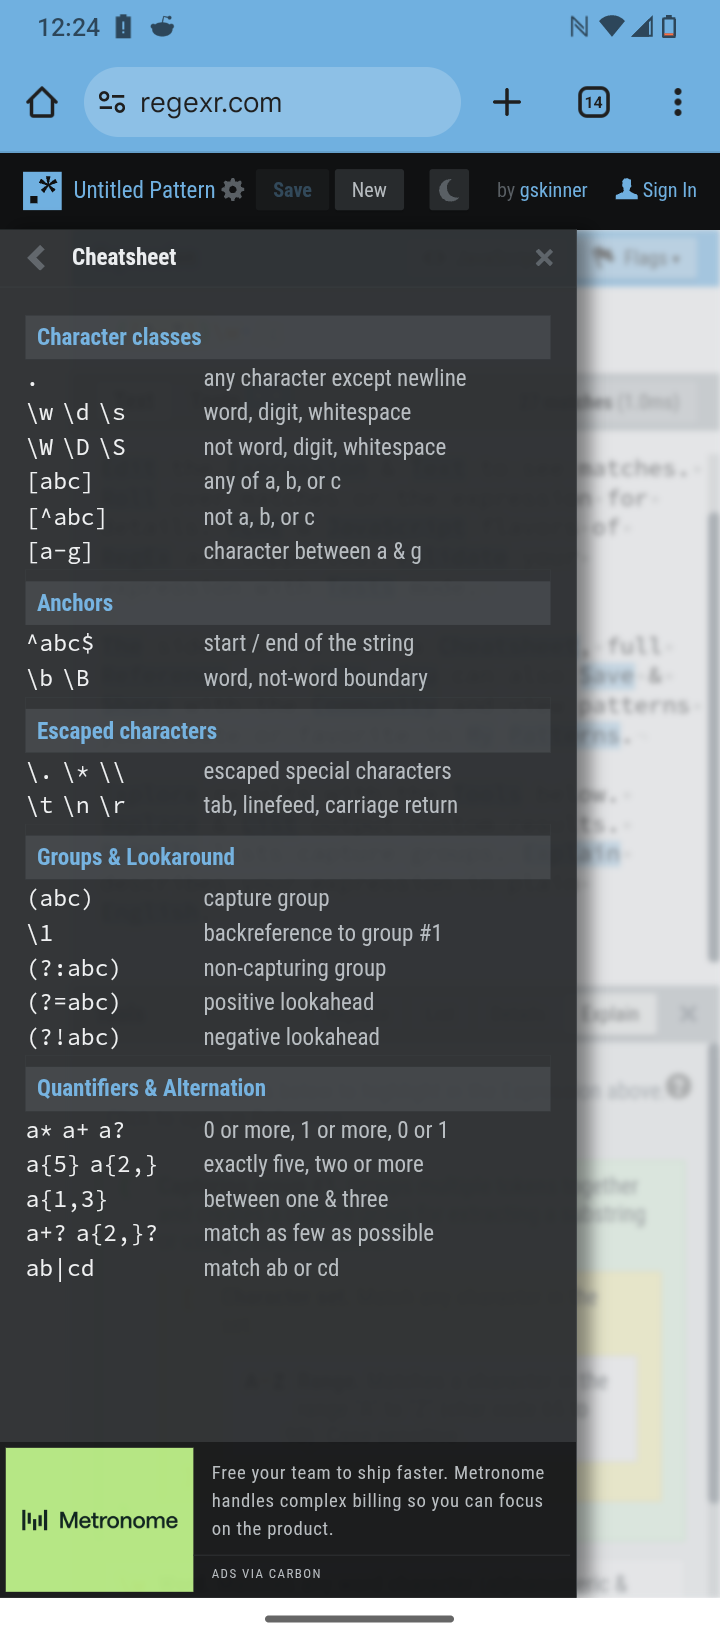
Here’s a great website that allows you to test RegEx programming language and the website explains the syntax too!

https://regexr.com/

You’ll become very advanced learning these two programming languages inside R as part of the prep work before doing your data analysis in R programming language.

What are APIs?

Application Programming Interface (API) are created or come with a software so that you can access the data from another software. This is highly important for analysis work, because you’ll need it to access the data.

There’s free training on understanding an API. APIs can connect to your analytical software you are using, like R, so you can pull data from a database. Good thing to know and understand as you embark or progress in a data driven career!

Fun Data Blog to Follow: Little Miss Data

There’s a great blog to follow if you are a data geek or just getting started in learning about data analysis: Little Miss Data.

The blog was started by Laura Ellis, a proclaimed data geek, who works for IBM. She aims to make data science and analytics accessible to everyone. She does articles, tutorials, and #FUNDATAFRIDAY posts that are 3 minute reads on cool data resources she finds.

What’s the difference between a data analyst and data scientist?

There are different type of data analysis jobs. Two of the main positions are data analyst and data scientist.

Here’s a breakdown of the differences:

While both positions deal with analyzing data, the main difference is the focus of the analysis. Data analysts examine data to identify trends, develop charts, and create visual presentations to help businesses make more strategic decisions. The best data analysts have both technical expertise and the ability to communicate well about their quantitative findings to non-technical colleagues or clients. A data scientist focuses on designing and constructing processes for data modeling and production, using such things as algorithms and predictive models.

According to Robert Half Technology (RHT)’s 2020 Salary Guide, data analysts have an earning potential of between $83,750 and $142,500, and data scientists have an earning potential of between $105,750 and $180,250 per year.

Thanks to companies’ need to make sense of and capitalize on their data, qualified individuals for data-focused careers, such as data analyst and data scientists, are in high demand in the job market today.

Data Visualization Style Guides

Companies usually have guidlines for their branding and marketing to have a cohesive look for the outward audiance, including a data visualization style guide. These style guides help create a uniform look and feel to all the charts and tables for reporting.

Recently the Medium published an article by Amy Cesal of twenty-four data visualization style guide examples. These examples included non-profits, like Sunlight Foundation and Urban Institute; government, like Consumer Financial Protection Bureau; for-profit organizations, like IBM; and journalism, like BBC.

Places I worked in the private sector, non-profit, and government had manuals and guidelines, but some were missing data visualization style guides. If your organization does not have one already, I would look at these twenty-four examples for ideas on where to get started on your own.